Uni-QSAR Analysis
Introduction
QSAR, or Quantitative Structure-Activity Relationship, is a method to describe the relationship between a compound's structure and its biological activity using mathematical models.
Hermite's QSAR module, constructed using Machine Learning and Deep Learning methods, can perform comparative analysis based on the built-in Uni-QSAR model.
This tutorial will guide you through utilizing the "Uni-QSAR Analysis" module to compare the performance of trained models.
1. QSAR Model Performance Comparison
1.1 Accessing Uni-QSAR Analysis
Navigate to "Function" → "Molecular Recommendation" → "Uni-QSAR Analysis".
1.2 Model Selection for Comparison
Begin by choosing the "Binary Classification" model type. The system will display corresponding models based on your selection.
From the list, select "Model_Sweet10" and "Model_Sweet20" for comparison.
Note: Adjust your selections as needed based on the models you've previously trained..
Click "Submit" to initiate the comparison task.
| Model type | Description |
| Binary Classification | The model predicts a single property, categorizing data into one of two groups |
| Single-Target Regression | The model is built to predict a single, continuous property. |
| Multi-Label Classification | The model predicts multiple properties simultaneously, categorizing data across several dimensions |
| Multi-Target Regression | The model predicts multiple continuous properties, offering a broader analysis of the data |
2. QSAR Model Comparison Results
2.1 Accessing Job Results
Navigate to "Job" and search for the specific task you need to review.
2.2 Displaying Model Performance Comparison
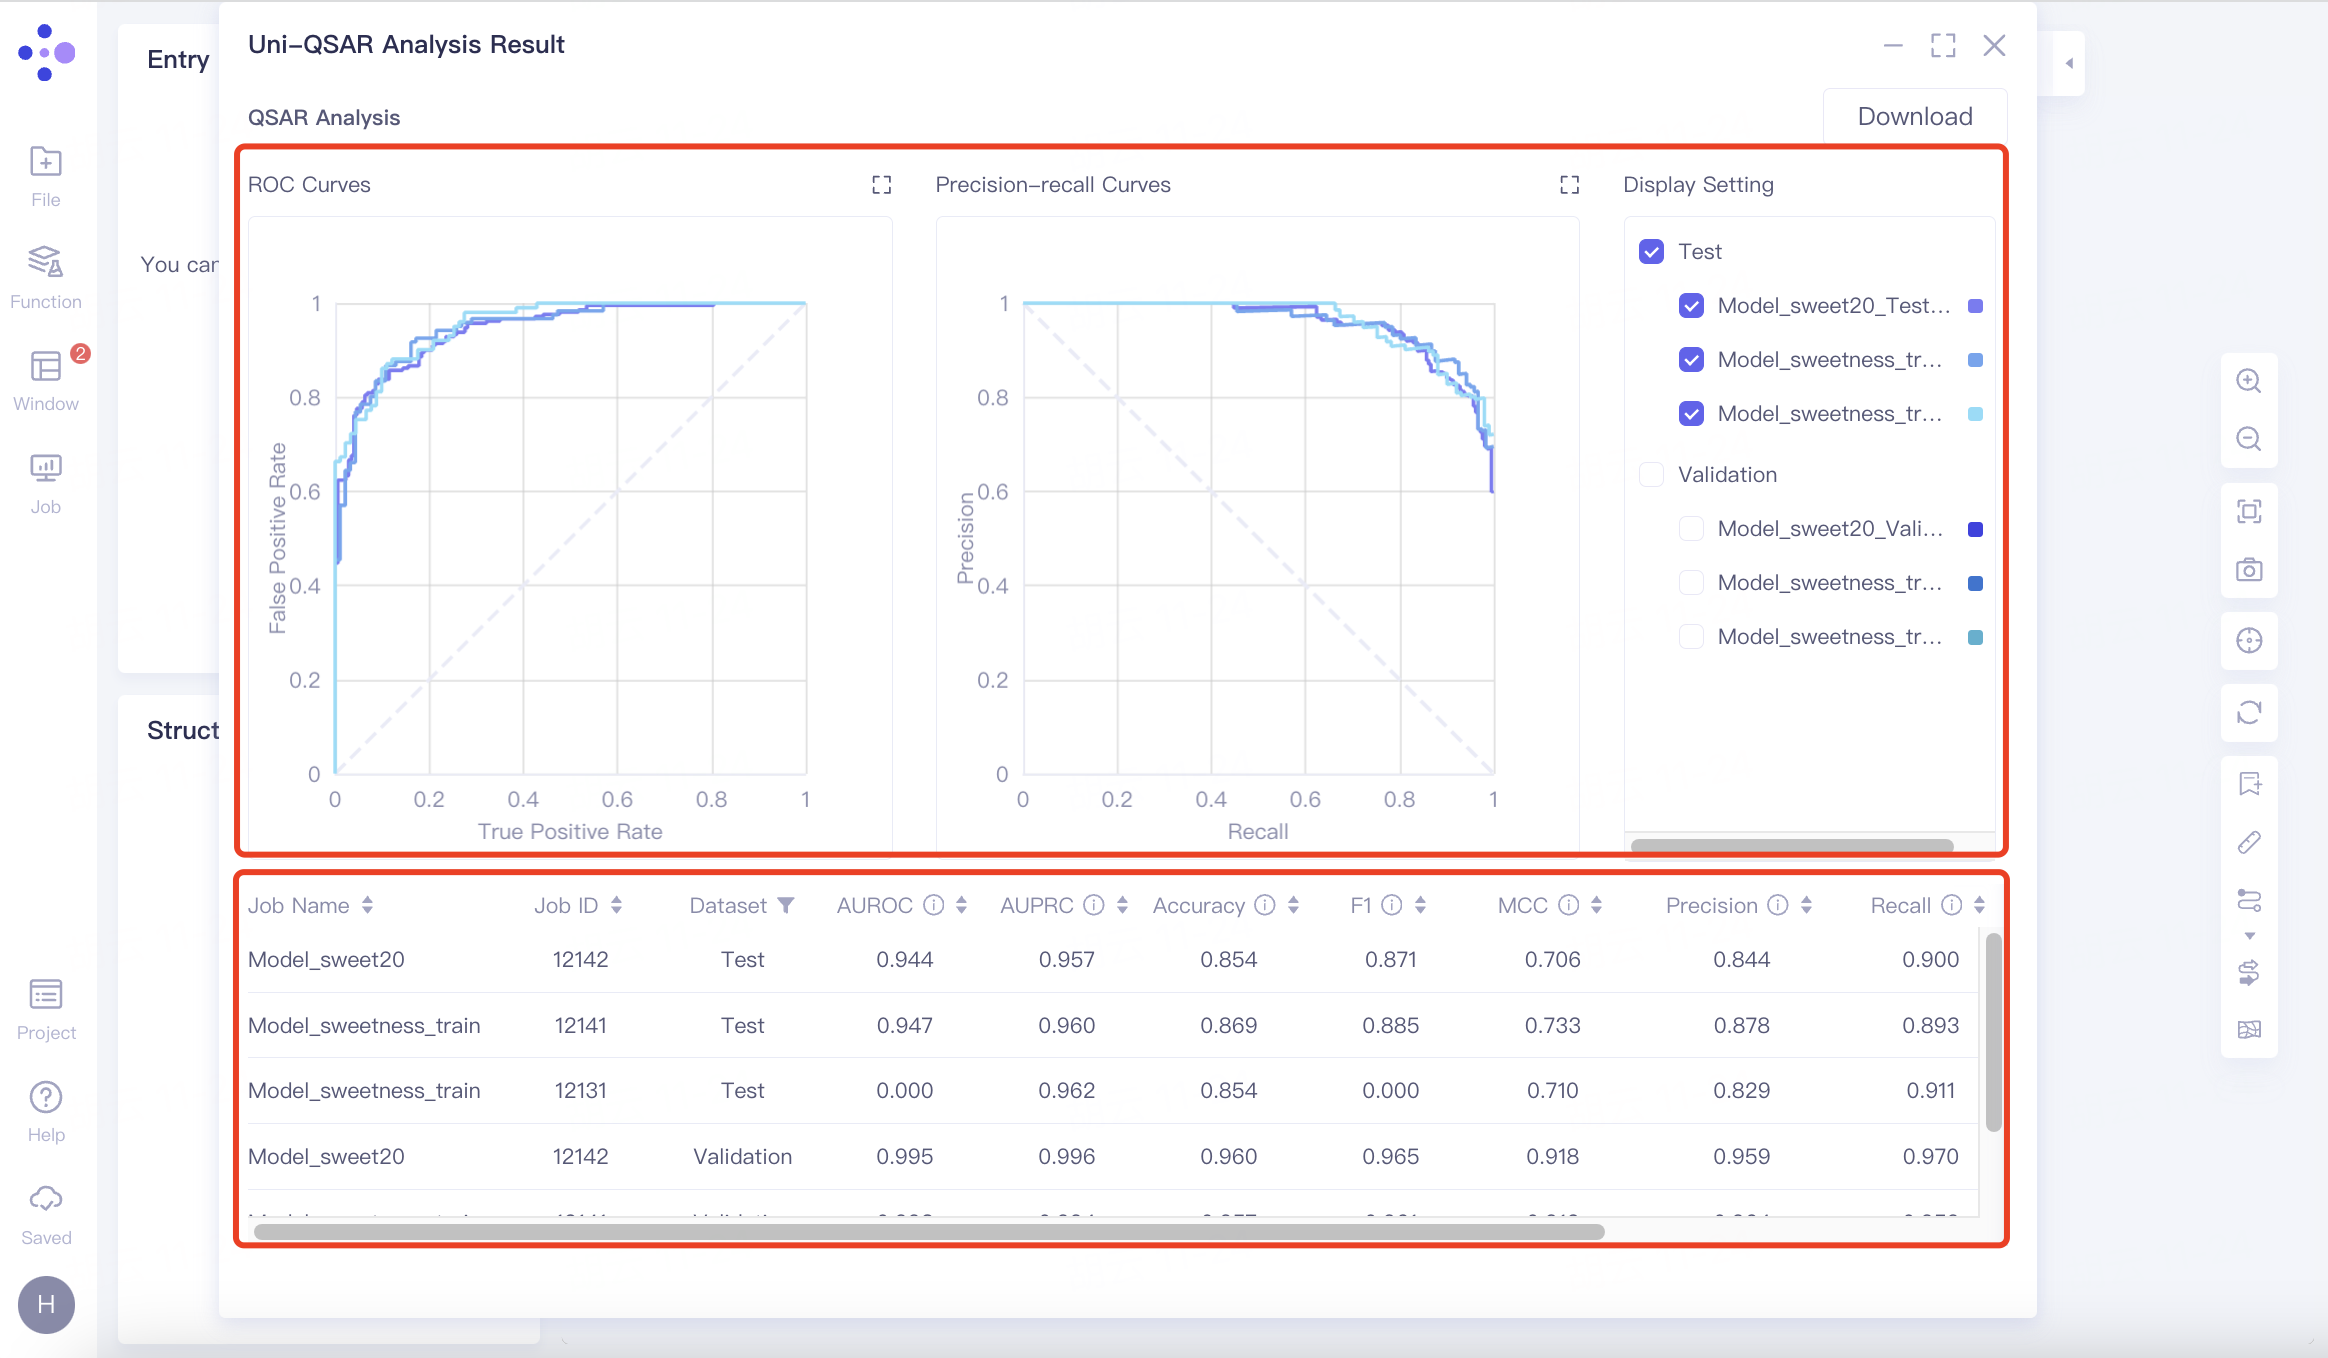
In this example, "Model_Sweet10" demonstrates marginally superior performance to "Model_Sweet20," as indicated by their ROC curves, PR curves, and metric outcomes.
2.2.1 Binary Classification Evaluation
The results are presented in two formats:
1)Image:
ROC Curves: Displayed for various thresholds, these curves plot the True Positive Rate (TPR) against the False Positive Rate (FPR), with the Area Under the ROC Curve (AUROC) indicating the model's performance—the higher the AUROC, the better.
Precision-Recall Curves: These illustrate the trade-off between precision and recall for different thresholds. The Area Under the Precision-Recall Curve (AUPRC) reflects the model's effectiveness - the greater the AUPRC, the more accurate the model.
Display Setting: Adjust the display of ROC and PR curves using the legend.
2)Table:
This section documents each model's performance metrics on the validation and test datasets.
Refer to the "Uni-QSAR" documentation for detailed descriptions of each metric.
To download the visual representations and data, click "Download" in the upper right corner to obtain the current images and table.
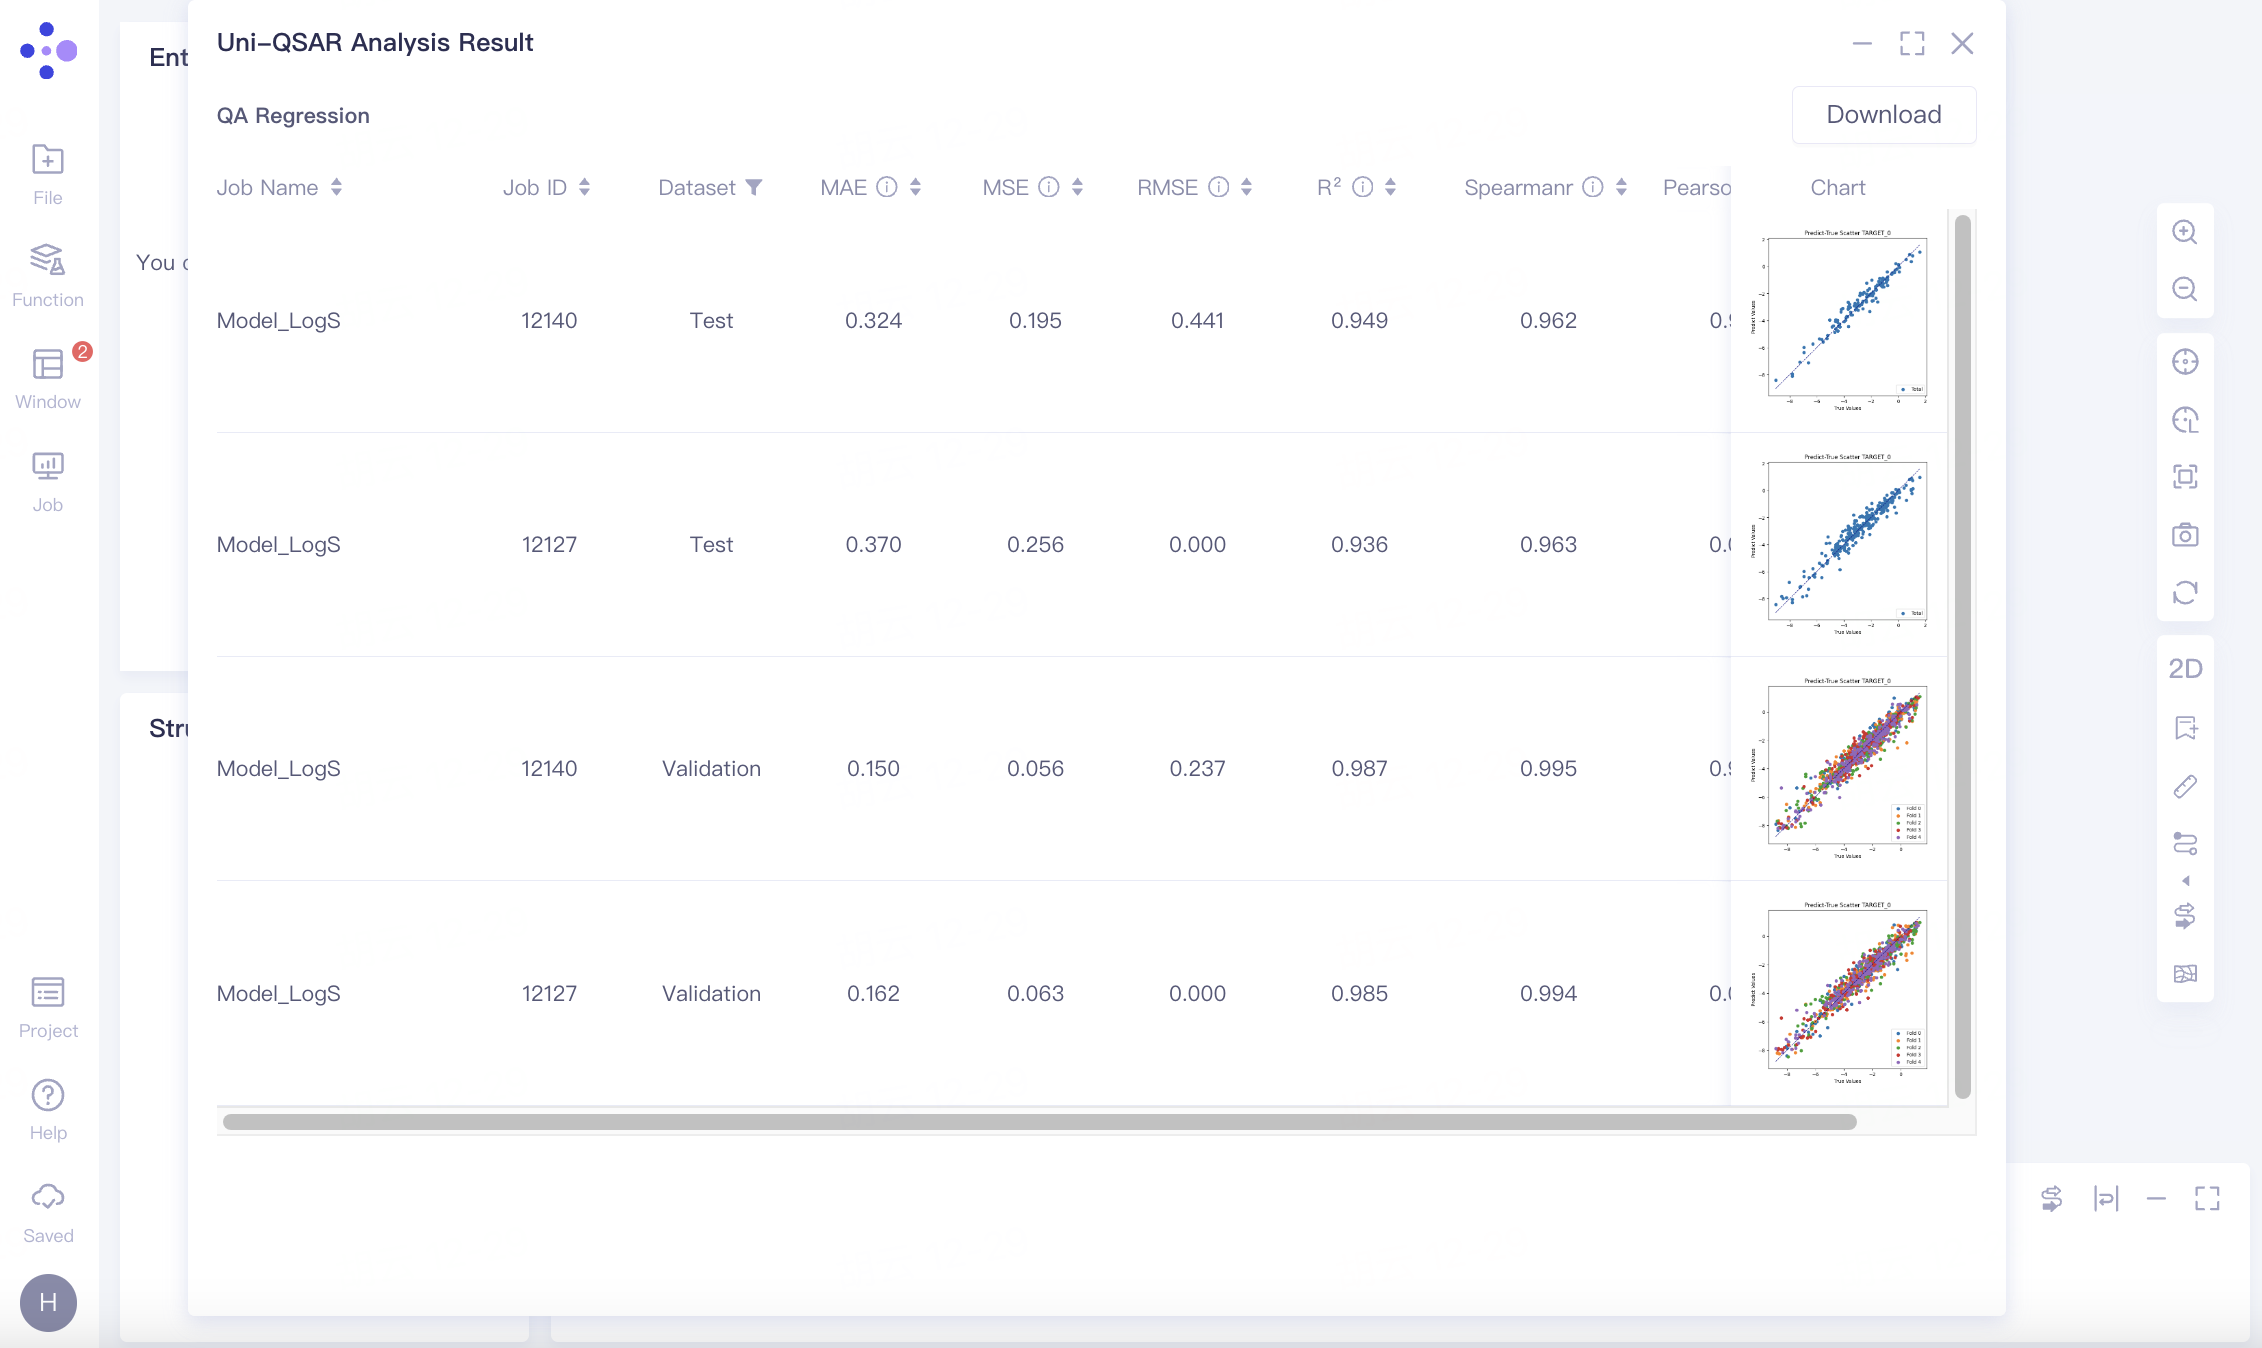
2.2.2 Single-Target Regression
The results include a detailed evaluation of each model's performance on validation and test datasets, represented through scatter plots that contrast predicted values against actual values.
Note: Refer to "Uni-QSAR" for detailed definitions and explanations of each metric.
To download the scatter plots and corresponding data tables, click "Download" in the upper right corner.
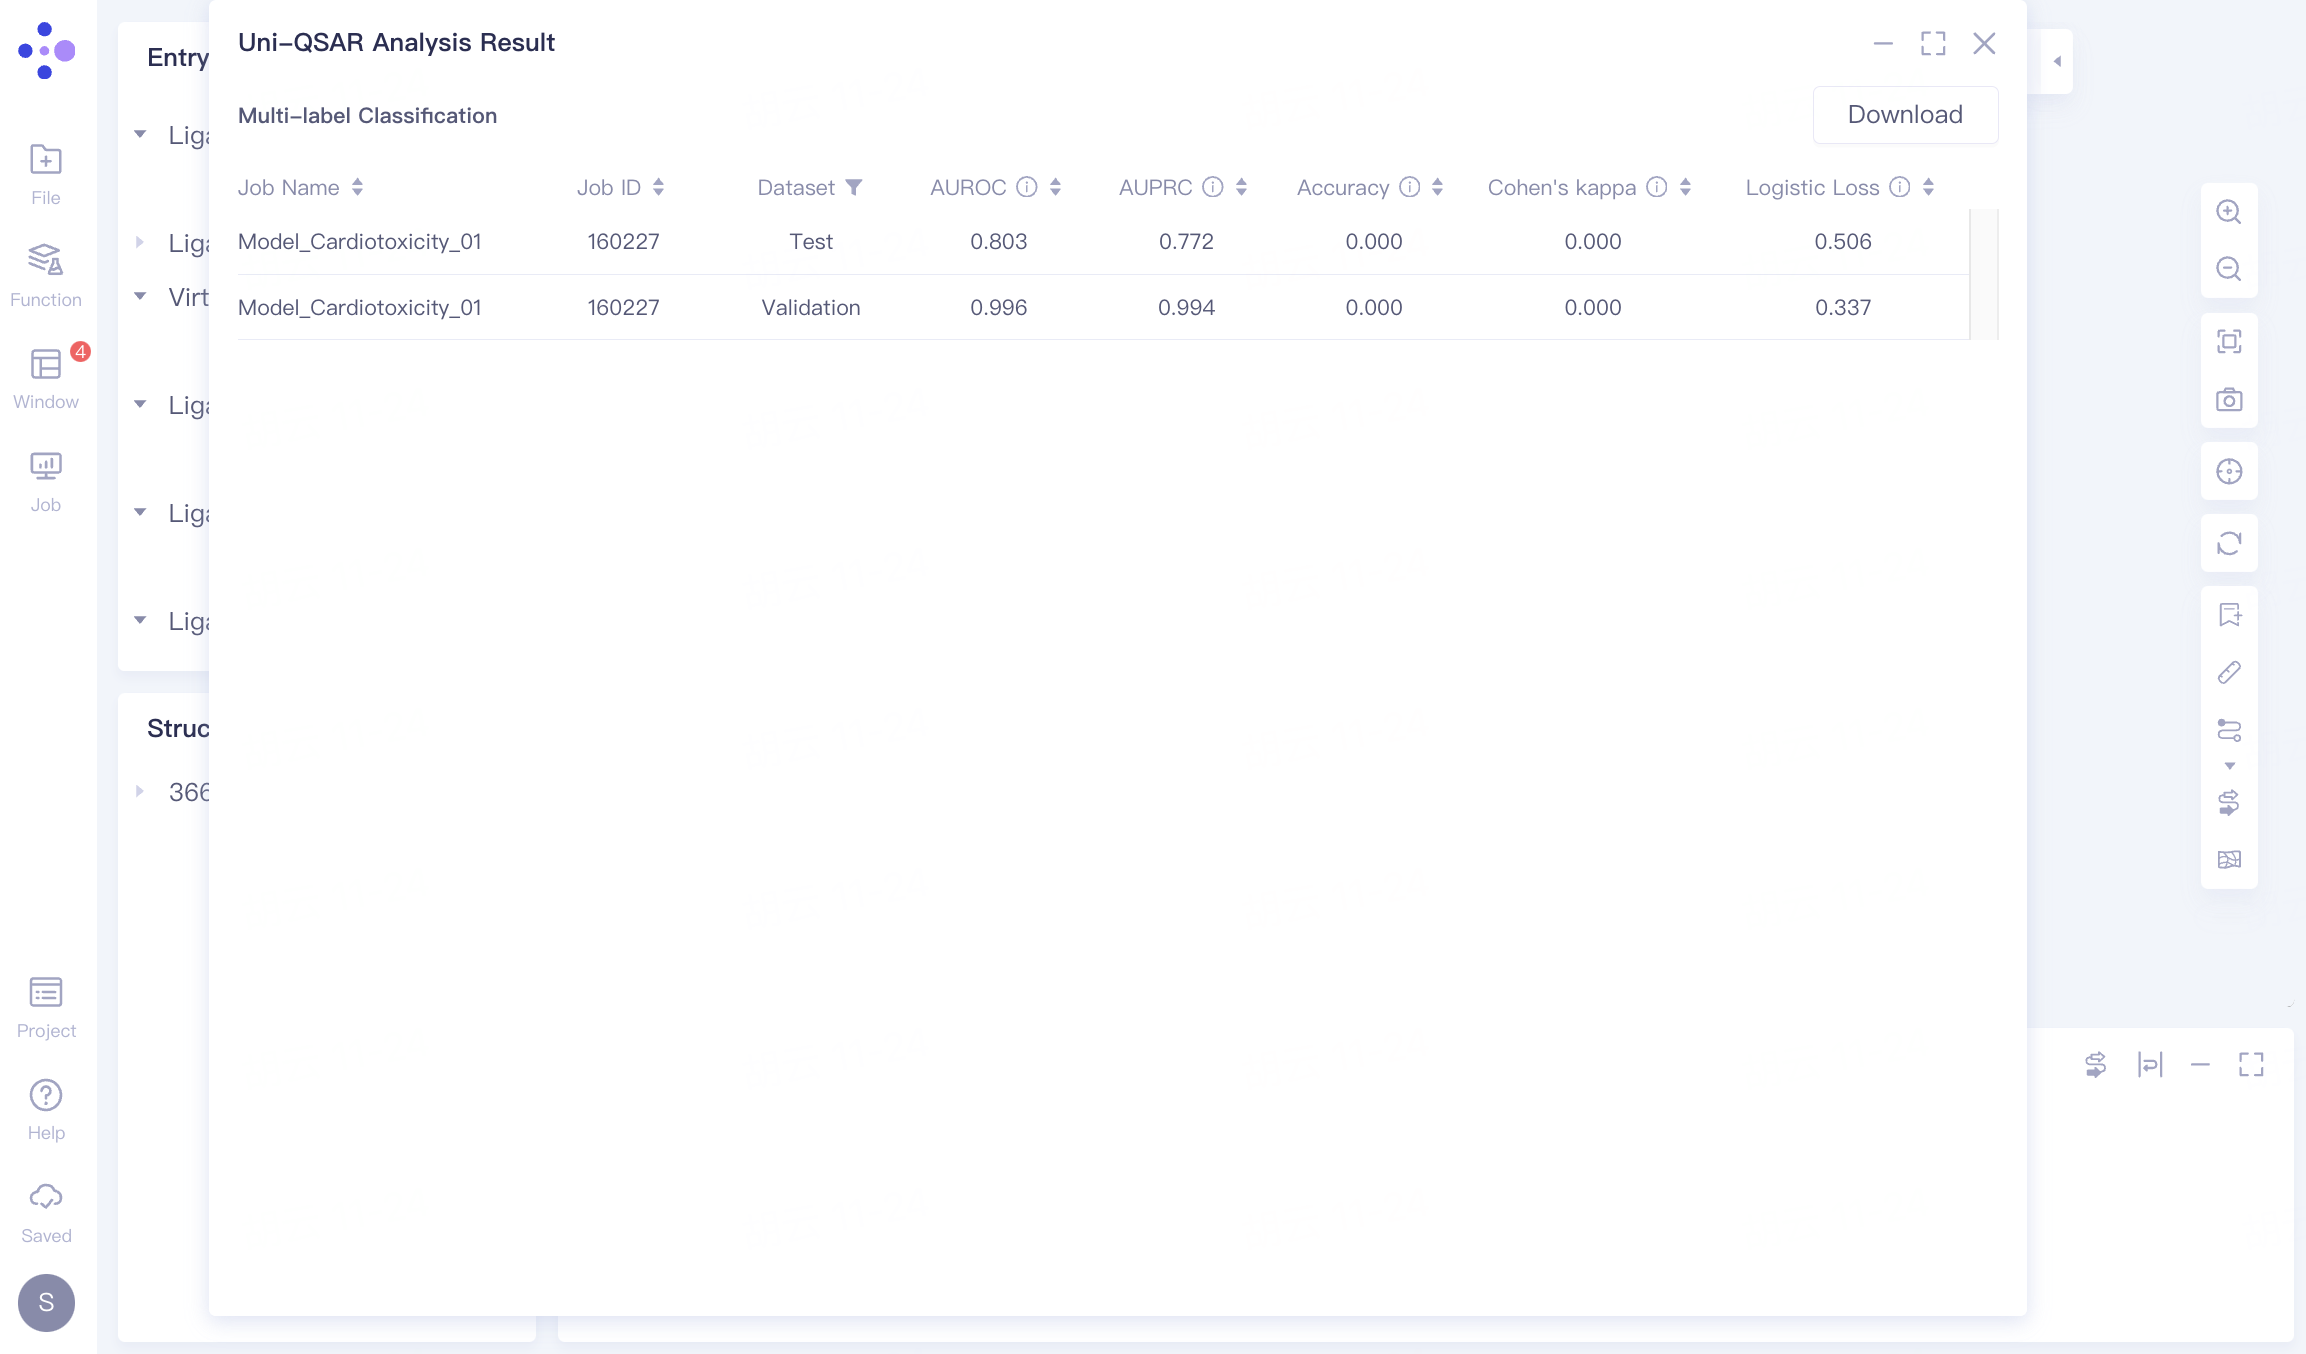
2.2.3 Multi-Label Classification
The results presents a comprehensive evaluation of each model's performance on validation and test datasets, detailing a range of metrics.
Note: For in-depth descriptions of each evaluation index, consult the "Uni-QSAR" documentation.
To save the detailed performance data, click "Download" in the upper right corner.
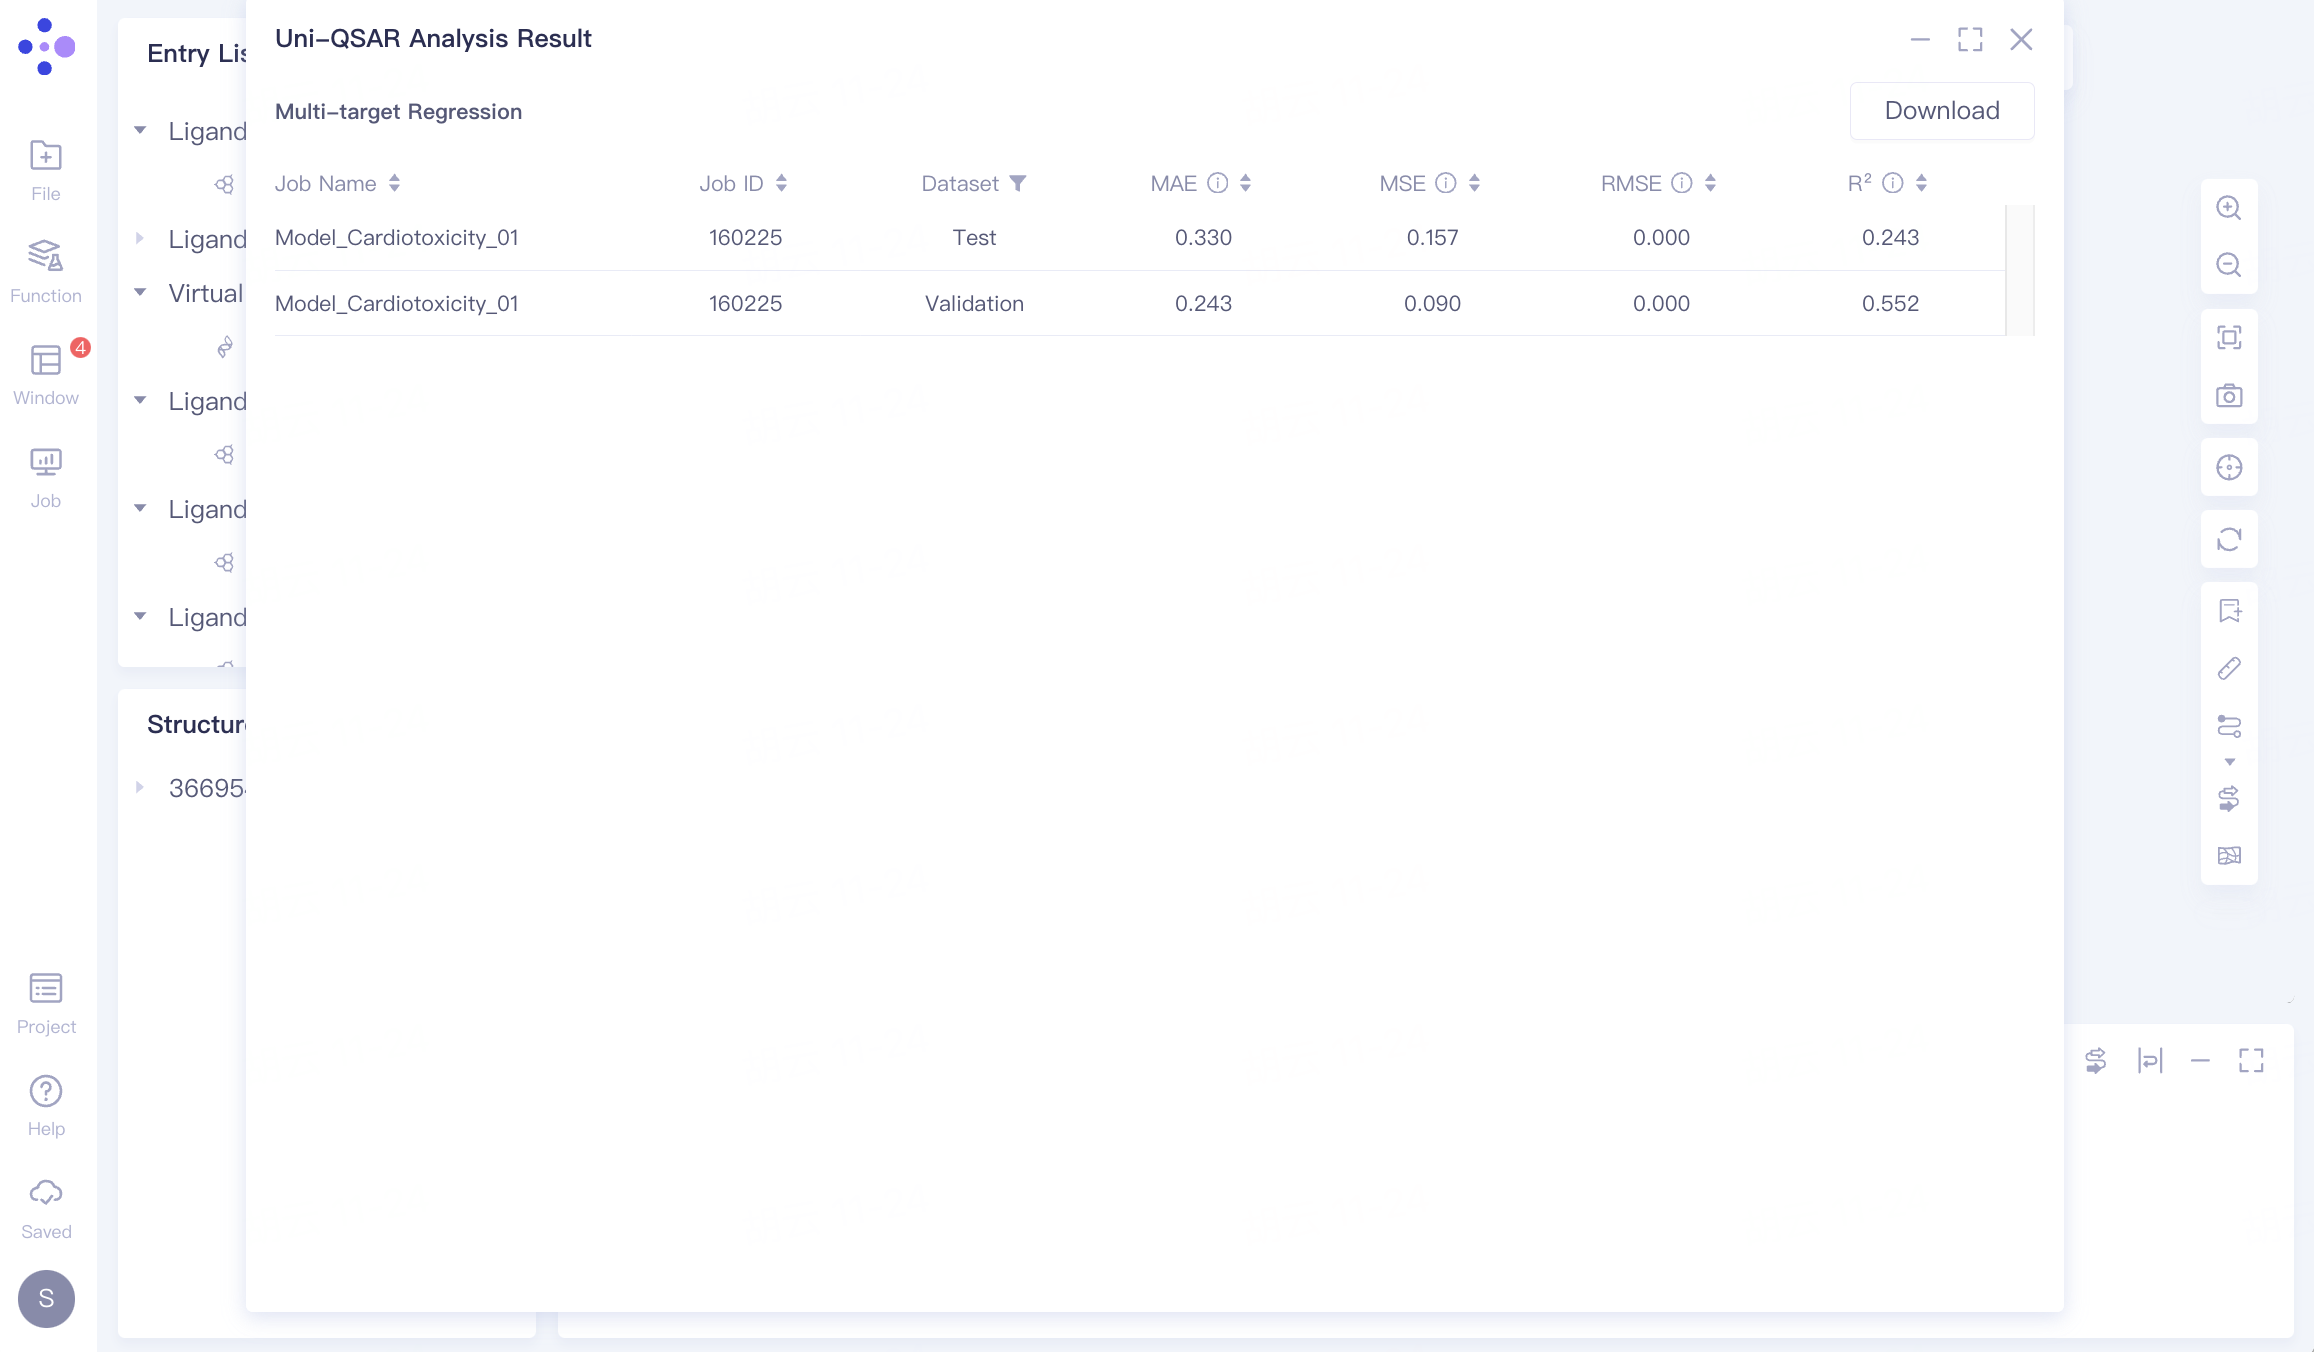
2.2.4 Multi-Target Regression
Here, the results provide an extensive assessment of each model's performance across validation and test datasets, with a focus on multi-target predictive accuracy..
Note: Refer to "Uni-QSAR" for a thorough understanding of each metric used.
To download the comprehensive evaluation, click "Download" in the upper right corner.